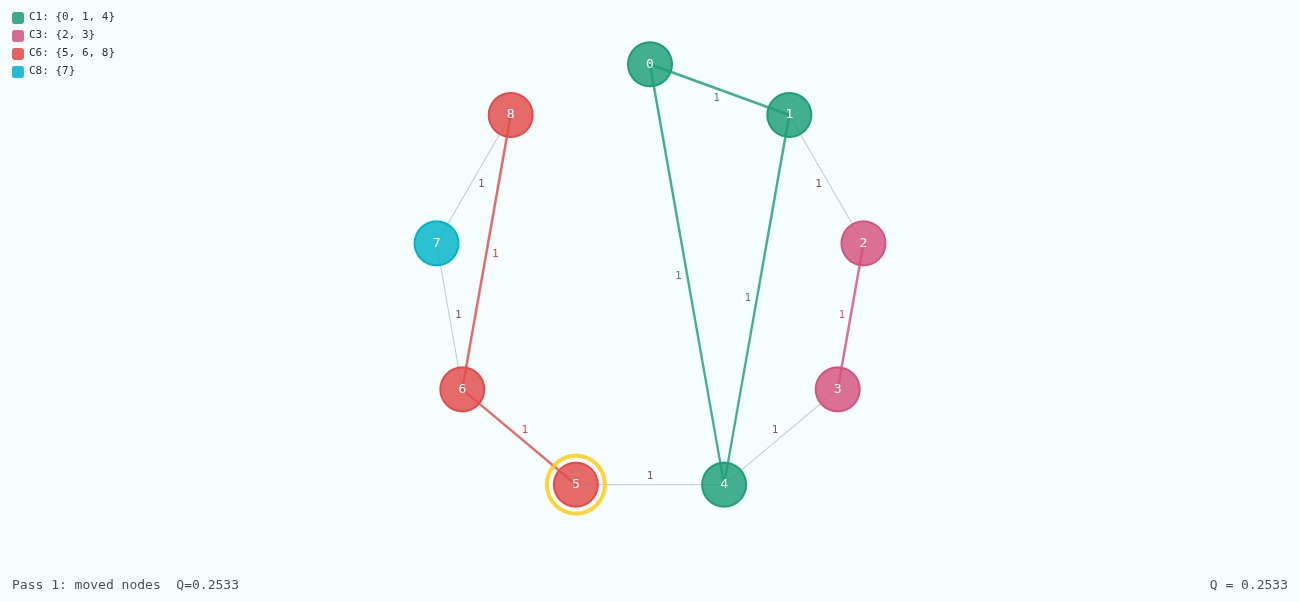
LOUVAIN
Project Overview and Links
This is an interactive project where you get to edit the adjacency matrix,
and thus the graph, and watch the algorithm divide it into communities.
To visit the project and try it out, please click
here 🔗
To view the full source code for this project, please click
here 🔗
Introduction & Inspiration
Humans are social creatures. We instinctively form friendships, relationships, and groups. If we step back, we notice some patterns in how people connect and form larger groups based on how they feel on the individual level. We are interested in modeling this mathematically. Given a graph of connected people, how can we divide them into communities, or groups, that make sense?
The First Step
How can we even begin to model people's relationships mathematically?
The most intuitive solution is building a graph.
A graph is a collection of nodes and edges that connect them, as shown
in the image below.
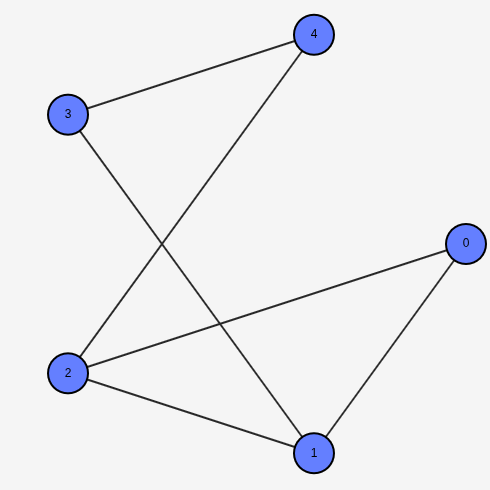
One way of representing relationships might be to consider each node as a person, and the edges between nodes as representing whether two people are connected or not. We can add a number on the edge to measure the variance in how close two people can be.
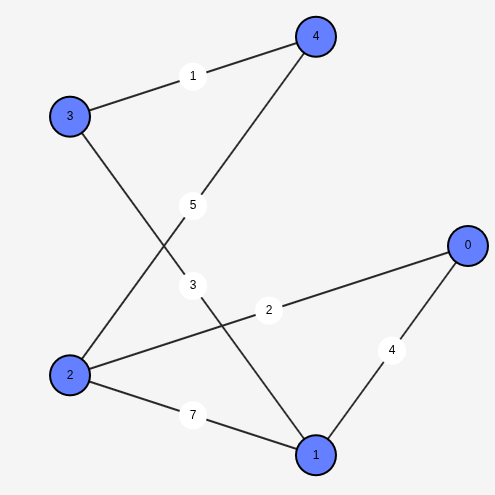
It is easier to work with matrices, and we represent a graph using an adjacency matrix, where the $(i, j)$ entry is the weight of the edge between nodes $i$ and $j$. Notice how the matrix is symmetric because the relationship between $i$ and $j$ is the same as the relationship between $j$ and $i$. For example, the adjacency matrix of the above graph is $$A = \begin{bmatrix} 0 & 4 & 2 & 0 & 0 \\ 4 & 0 & 7 & 3 & 0 \\ 2 & 7 & 0 & 0 & 5 \\ 0 & 3 & 0 & 0 & 1\\ 0 & 0 & 5 & 1 & 0 \\\end{bmatrix}$$
The Initial Metric
Suppose our graph is already divided into communities, where people
within a community are colored the same. How can we measure if this
division is "reasonable"?
One possibility is to find the fraction of edges within communities. The
idea is that good community divisions have more edges within the groups
than between the groups. If we take the weighted number of edges within
communities, and divide it by the total weighted number of edges, we
have an initial metric to test. $$M = \frac{\frac{1}{2} \sum\limits_{c
\in \mathcal{C}} \left( \sum\limits_{u \in c} \sum\limits_{v \in c}
A_{uv} \right)}{\frac{1}{2} \sum\limits_{u} \sum\limits_{v} A_{uv}}$$
where $C$ is the set of communities, $A$ is the adjacency matrix, and we
divide by $2$ because the matrix $A$ is symmetric as noted earlier. We
can simplify by defining $$m = \frac{1}{2} \sum\limits_{u}
\sum\limits_{v} A_{uv}$$ and our problem turns into an optimization
problem, namely $$\max_{\mathcal{C}} \; \frac{1}{2m} \sum\limits_{c \in
\mathcal{C}} \left( \sum\limits_{u \in c} \sum\limits_{v \in c} A_{uv}
\right)$$
There is one huge problem with this metric. Consider what happens when
we put the whole graph inside one single community. The sum over
communities term becomes useless and we get $$M = 1$$ meaning the best
possible community division is always to put everyone in the same
community! As lovely as that idea is, it's clearly wrong. But we don't
have to abandon our metric completely. It's a good starting point.
Modularity
We clearly need a better metric. The following argument is based on M.
E. J. Newman's
"Modularity and community structure in networks"
research. His insight was that a good division is not just one where
there are few edges between communities, but one where there are fewer
than expected edges between communities.
If the number of edges between two groups is what we would expect out of
randomness, then we cannot claim this division is meaningful. On the
other hand, if the number of edges between groups is much less than what
we would expect by chance, then it's reasonable to conclude that
something interesting is going on.
Newman calls this new metric modularity, and it's defined as follows $$
\text{Modularity} := \text{Actual} - \text{Random baseline} $$ where
$\text{Actual}$ is the fraction of edges that fall within the given
communities, and $\text{Random baseline}$ is the fraction of edges that
fall within the given communities if the edges were randomly
distributed. To allow for a fair comparison, $\text{Random baseline}$
should be evaluated for a graph that has the same number of nodes,
edges, and node degrees as the original graph.
So what's the expected value of edges between two nodes $u$ and $v$? Let $k_u$ and $k_v$ denote the degrees of nodes $u$ and $v$ respectively. Then we have $$\mathbb{E} = \frac{k_u k_v}{2m - 1}$$ Doing some algebraic manipulations, we get the final formula for the modularity, which we call the quality of some partition $C$: $$Q(C) := \frac{1}{2m} \sum_{c \in \mathcal{C}} \left( \Sigma_c - \frac{\Sigma_\hat{c}^2}{2m} \right)$$ where $$\Sigma_c := \sum_{u \in c} \sum_{v \in c} A_{uv}$$ and $$\Sigma_\hat{c} := \sum_{k \in c} k_v$$ With that, we've managed to formalize the idea of "good" vs "bad" paritions of a graph into communities.
The Louvain Algorithm
Our goal is to find the partition $\mathcal{C}$ for which modularity $Q(\mathcal{C})$ is the maximum. We use the Louvain algorithm, named after the university in Belgium where the algorithm was first created and published in the research paper "Fast unfolding of communities in large networks."
Phase 1: Modularity Optimization
The idea is simple. We start by assigning each node to its own community, and then iteratively merge the nodes whose amalgamation causes the greatest increase in modularity. When looking to merge, we consider a node and its neighbouring communities. Louvain is a greedy algorithm, in the sense that it always chooses the local optimum choice; that is, it makes the decision that causes the most immediate gain, regardless of how that affects future decisions. When iterations stop causing change, we know we've completed the first phase of Louvain, and achieved a local maximum of modularity.
Phase 2: Community Aggregation
In this phase, we take the communities of the previous phase, and treat each one as a new vertex. Edges within communities are condensed to self-loops with a weight that's twice as much as the total edge weight inside the community. We are multiplying by $2$ because our modularity equation divded by $2$ to account for the symmetry of the adjacency matrix, and we want to use the same formula. We also merge edges between each two communities into one edge. The algorithm goes back to phase 1, operating on this new graph. Why? To detect communities of communities! The two phases repeat until no further modularity improvement is possible.
Final Thoughts
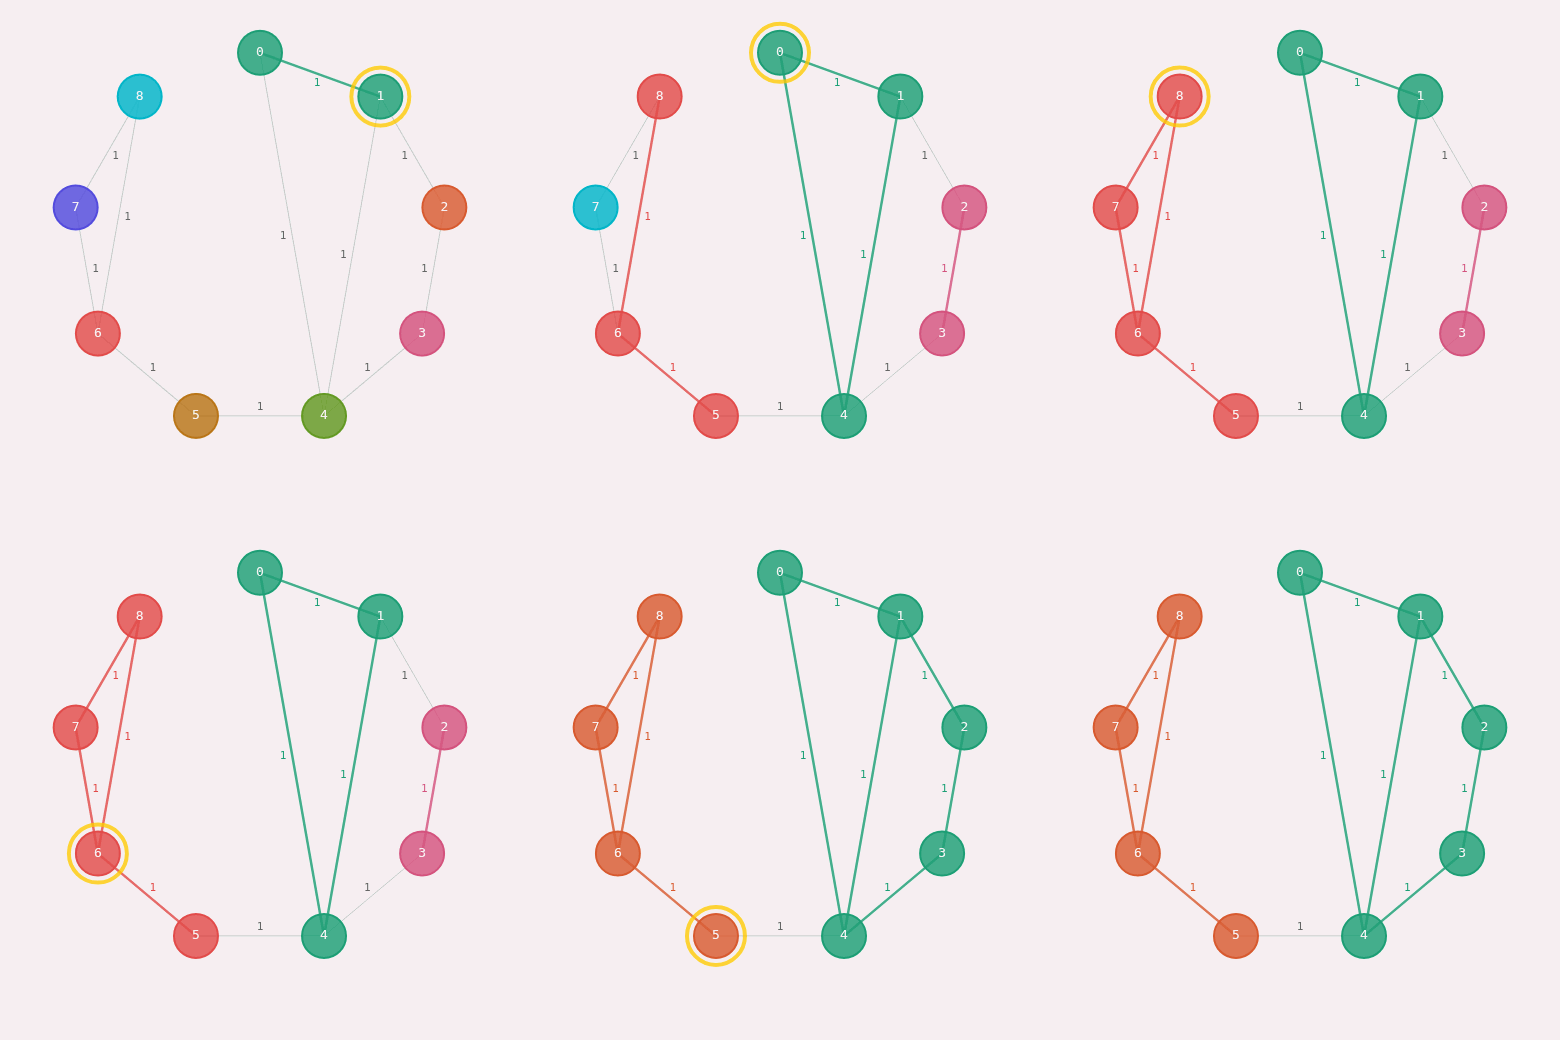
The Louvain algorithm, which optimizes the modularity of a graph, is a
simple idea applied to an interesting problem. It's a good example of
how researchers make simple, but reasonable, assumptions and develop
entire models around them.
Please play around with the full project using the links above! You can
change the adjacency matrix to model any graph, and watch it getting
divided into communities step-by-step!